In the realm of financial markets, particularly in the world of stocks, investors often seek indicators and signals to guide their trading decisions. One such tool, the weekly linear regression chart, has recently signaled a buy opportunity for Google, the technology giant known for its search engine prowess and diverse array of products and services. This buy signal suggests a potential uptick in Google’s stock price in the coming week, with a target price of $155. Let’s delve into what this signal means and why it has sparked optimism among investors.
Understanding the Weekly Linear Regression Chart
Before delving into Google’s specific situation, let’s first understand what a weekly linear regression chart is and how it’s utilized in stock market analysis.
A weekly linear regression chart is a technical analysis tool that helps investors identify trends and potential reversal points in a stock’s price movement over a weekly timeframe. It plots a straight line based on past price data, aiming to capture the overall trend of the stock. This trend line serves as a reference point for assessing the stock’s current price relative to historical price movements.
When analyzing a weekly linear regression chart, investors pay close attention to the slope of the trend line and its relationship with the current price of the stock. A positive slope indicates an upward trend, suggesting that the stock’s price is likely to continue rising. Conversely, a negative slope suggests a downward trend, signaling potential weakness in the stock’s price.
Google’s Buy Signal
Now, let’s turn our attention to Google and its recent buy signal on the weekly linear regression chart.
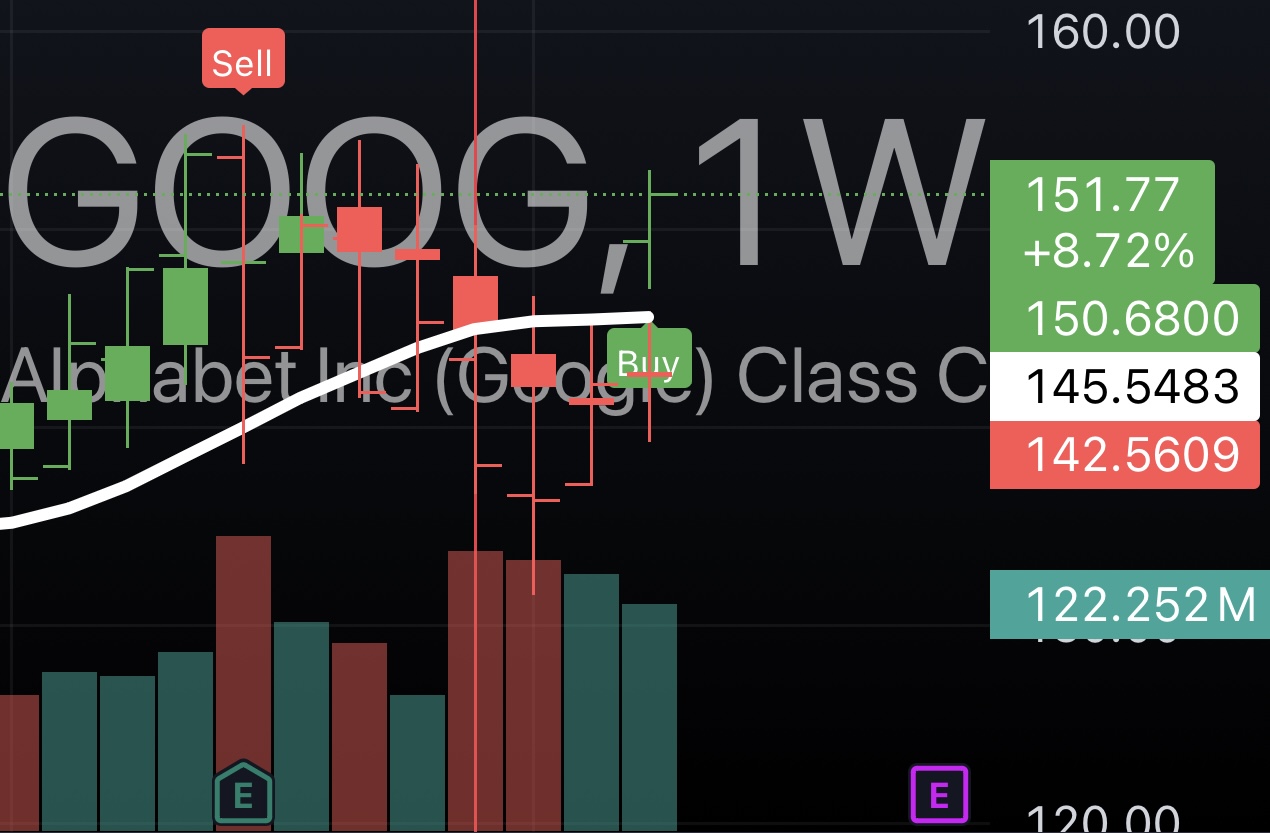
Google, or Alphabet Inc. as it is formally known, is a leading player in the technology industry, with its core search engine business supplemented by ventures in areas such as cloud computing, advertising, and autonomous vehicles. As such, the performance of Google’s stock is closely monitored by investors worldwide.
Recently, Google’s weekly linear regression chart has exhibited a positive slope, indicating an upward trend in the stock’s price. This suggests that Google’s stock has been steadily appreciating over the weekly timeframe, reflecting growing investor confidence and positive market sentiment.
The buy signal on the weekly linear regression chart further reinforces this bullish outlook. It suggests that Google’s stock is poised for further gains in the near term, with the potential to reach a target price of $155. This target price represents an uptick from the current price level, offering potential upside for investors who position themselves accordingly.
Factors Driving Google’s Uptick
Several factors may be contributing to the bullish outlook for Google’s stock and the buy signal on the weekly linear regression chart:
- Strong Financial Performance: Google has consistently delivered strong financial results, driven by its dominant position in online search and advertising. Robust revenue growth, coupled with disciplined cost management, has bolstered investor confidence in the company’s ability to generate sustainable long-term returns.
- Innovation and Diversification: Google continues to innovate across various fronts, from artificial intelligence and machine learning to cloud computing and autonomous driving. Its diverse portfolio of products and services positions the company well to capitalize on emerging trends and capture new revenue opportunities.
- Market Leadership: Google’s leadership position in online search and digital advertising affords it a competitive advantage in an increasingly digital world. As businesses shift their advertising budgets online and consumers rely more on digital services, Google stands to benefit from this secular trend, driving revenue growth and shareholder value.
- Macroeconomic Tailwinds: Favorable macroeconomic conditions, including low interest rates and robust consumer spending, provide a supportive backdrop for Google’s stock price. As the broader economy continues to recover from the impacts of the COVID-19 pandemic, investors may increasingly allocate capital to high-quality growth stocks like Google.
Risks and Considerations
While the buy signal on the weekly linear regression chart and the bullish outlook for Google’s stock are encouraging, it’s essential for investors to consider potential risks and uncertainties:
- Market Volatility: Financial markets can be unpredictable, and sudden shifts in investor sentiment or macroeconomic conditions could impact Google’s stock price. Increased market volatility may lead to short-term fluctuations in the stock’s price, requiring investors to maintain a long-term perspective.
- Regulatory Scrutiny: As a dominant player in the technology industry, Google is subject to regulatory scrutiny from governments around the world. Antitrust concerns, data privacy regulations, and other regulatory challenges could potentially affect Google’s business operations and financial performance.
- Competition: Google operates in highly competitive markets, facing rivals ranging from other tech giants to startups and disruptors. Intense competition could pressure Google’s market share, pricing power, and profitability, potentially impacting its stock price.
- Execution Risks: Despite its track record of success, Google faces execution risks related to product development, strategic initiatives, and operational efficiency. Failure to effectively execute on its growth plans could hamper Google’s ability to meet investor expectations and sustain its stock price momentum.
Conclusion
In conclusion, Google’s recent buy signal on the weekly linear regression chart suggests a bullish outlook for the company’s stock in the coming week, with a target price of $155. This positive momentum is driven by factors such as strong financial performance, innovation, market leadership, and favorable macroeconomic conditions.
However, investors should remain mindful of potential risks and uncertainties, including market volatility, regulatory scrutiny, competition, and execution risks. By carefully evaluating these factors and maintaining a disciplined investment approach, investors can make informed decisions regarding their exposure to Google’s stock and capitalize on potential opportunities in the dynamic world of financial markets.


