
To view the AI Chart on IWM visit: https://optionsdoctor.com/
In the ever-evolving world of financial markets, the integration of Artificial Intelligence (AI) into trading strategies has transformed the landscape. Among the numerous AI-driven tools, AI charts have emerged as powerful instruments, capable of predicting market movements with remarkable accuracy. This article delves into a fascinating case study where AI charts successfully forecasted an upward $12 move in the iShares Russell 2000 ETF (IWM) over the past few weeks, demonstrating their potential to revolutionize trading strategies.
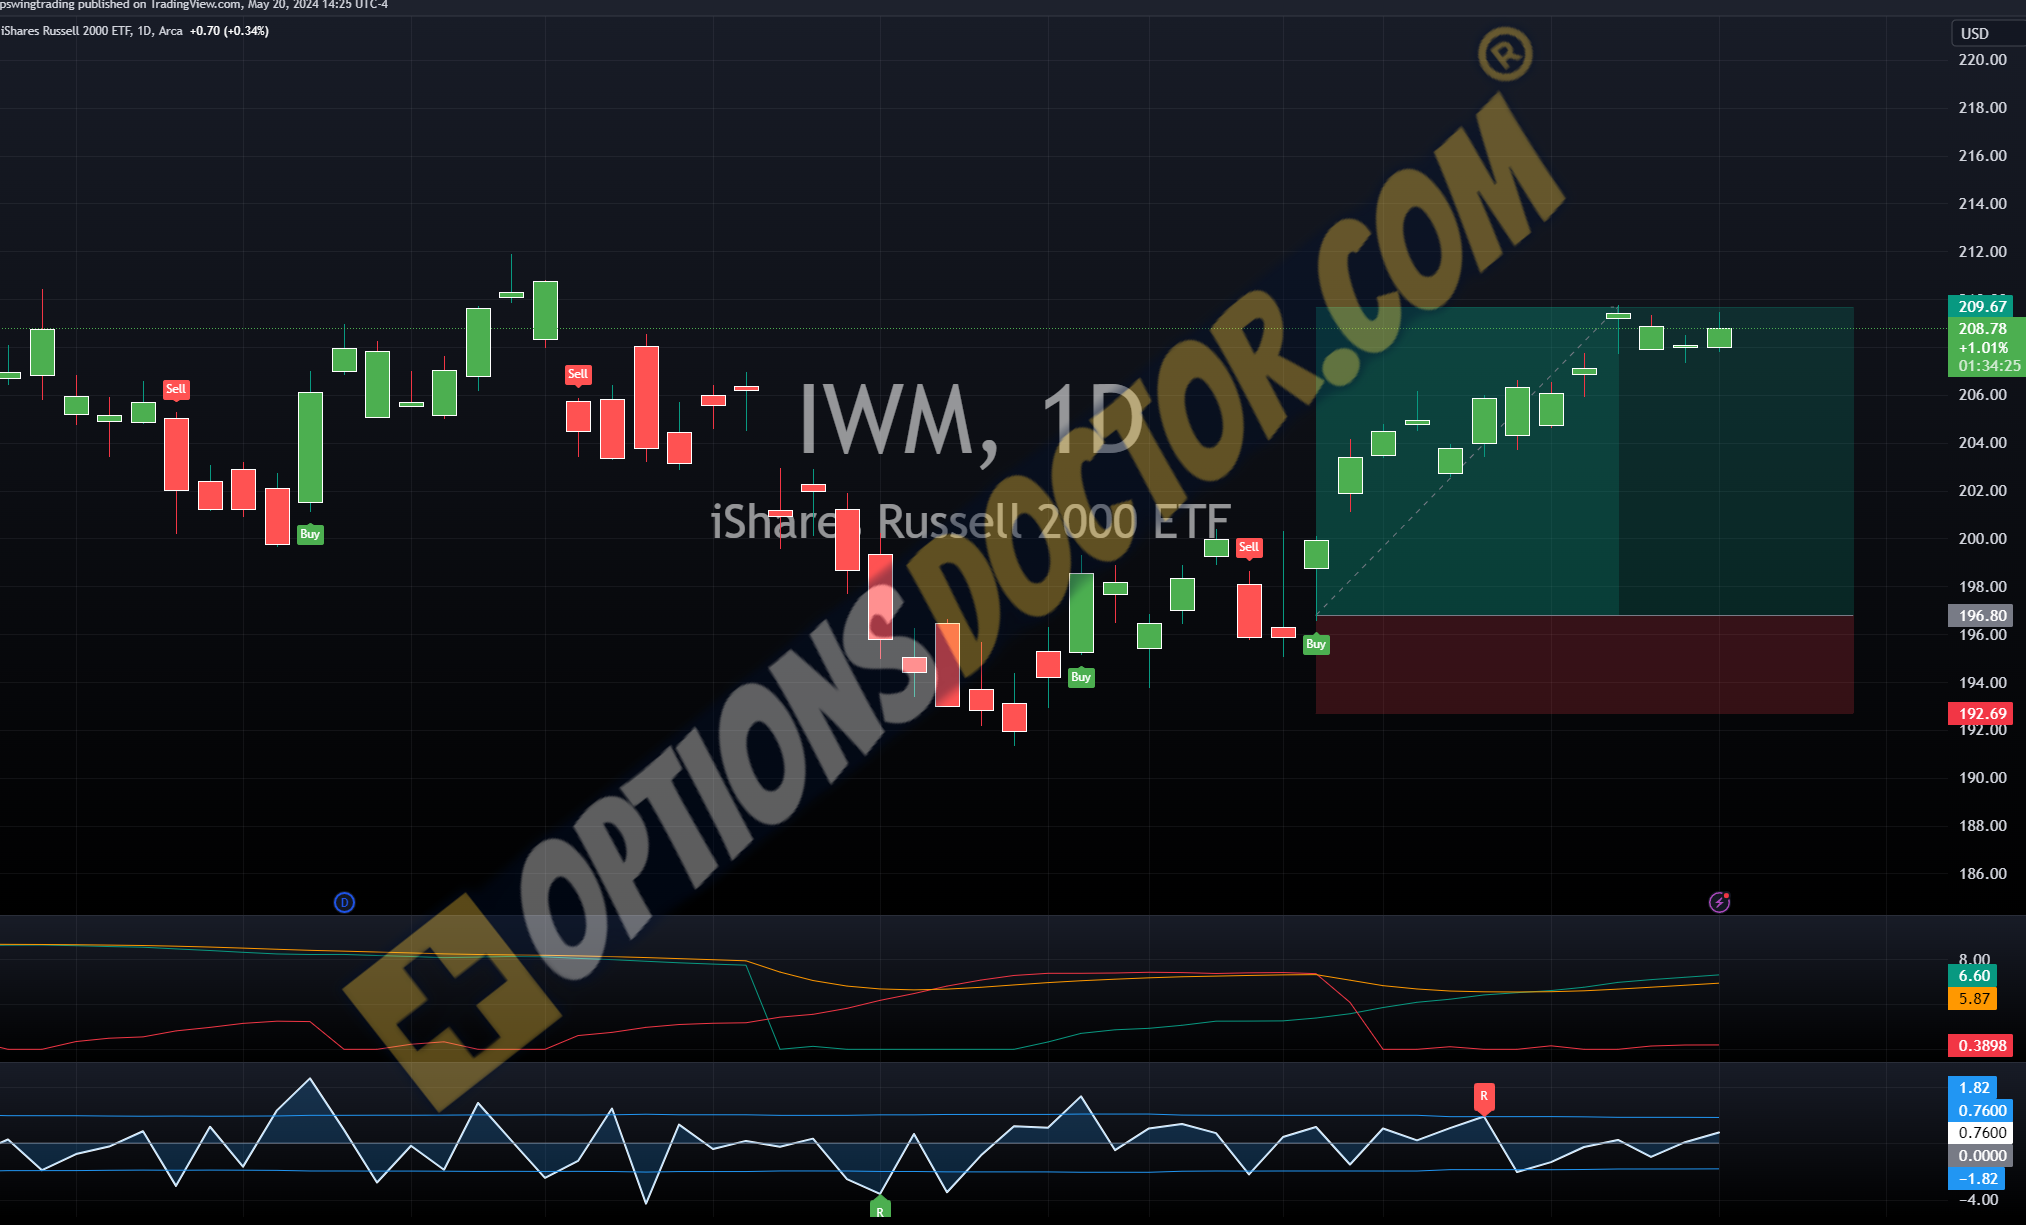
The Context: Understanding IWM
The iShares Russell 2000 ETF (IWM) is one of the most popular exchange-traded funds (ETFs) that tracks the performance of the Russell 2000 Index, which comprises the smallest 2,000 stocks in the Russell 3000 Index. This ETF is a bellwether for the performance of small-cap stocks, making it a crucial indicator for market sentiment and economic health.
In recent weeks, IWM has experienced a notable upward movement, surging by $12. This significant price change caught the attention of traders and analysts alike. However, what sets this movement apart is the fact that it was anticipated by AI-driven chart analysis, highlighting the predictive prowess of AI in financial markets.
The Mechanics of AI Charts
AI charts utilize complex algorithms and machine learning techniques to analyze historical price data, trading volumes, market sentiment, and various other indicators. These charts are capable of identifying patterns and trends that may not be immediately apparent to human analysts. By continuously learning from new data, AI charts can refine their predictions and provide more accurate forecasts.
In the case of IWM, the AI charts employed a combination of technical analysis, pattern recognition, and sentiment analysis to predict the upward movement. Let’s break down how these components contributed to the successful prediction.
Technical Analysis: Recognizing Patterns
Technical analysis has been a cornerstone of trading strategies for decades. AI charts enhance this traditional approach by leveraging advanced pattern recognition capabilities. In the case of IWM, the AI charts identified a bullish flag pattern—a continuation pattern that signals the resumption of an existing trend after a brief consolidation period.
The AI system detected that IWM was in a consolidation phase after a previous uptrend. By analyzing historical instances where similar patterns occurred, the AI projected a high probability of an upward breakout. The accuracy of this prediction was further enhanced by the AI’s ability to process vast amounts of data and identify subtle nuances that human analysts might miss.
Sentiment Analysis: Gauging Market Mood
Market sentiment plays a crucial role in driving price movements. AI charts incorporate sentiment analysis by parsing news articles, social media posts, and other textual data to gauge the overall mood of the market. For IWM, the AI system detected a shift in sentiment from bearish to bullish over the past few weeks.
This shift was influenced by several factors, including positive economic data, optimistic earnings reports from small-cap companies, and overall market resilience. By quantifying sentiment changes and correlating them with historical price movements, the AI charts were able to strengthen the prediction of an upward move in IWM.
Volume Analysis: Confirming Trends
Trading volume is another critical indicator that AI charts consider. Analyzing volume patterns helps in confirming the strength of a trend. In the case of IWM, the AI charts noted an increase in trading volume during the consolidation phase, suggesting strong investor interest and the likelihood of a breakout.
By combining volume analysis with technical and sentiment indicators, the AI system provided a comprehensive view of the market dynamics. This holistic approach significantly contributed to the accurate prediction of IWM’s upward move.
The Impact: Realizing the Prediction
The AI charts’ prediction of a $12 upward move in IWM was realized over a span of several weeks. As the ETF broke out of the consolidation phase, it gained momentum, driven by positive market sentiment and robust trading volumes. Traders who leveraged AI chart analysis were able to position themselves advantageously, capitalizing on the predicted price movement.
This case study underscores the transformative potential of AI in trading. By integrating advanced analytical techniques and real-time data processing, AI charts can offer a competitive edge to traders, enabling them to anticipate market movements with greater precision.
The Future: AI Charts and Market Predictability
The successful prediction of IWM’s upward move is just one example of how AI charts can revolutionize trading strategies. As AI technology continues to evolve, we can expect even more sophisticated and accurate predictive tools. The integration of AI in financial markets is not just a trend but a paradigm shift that is reshaping the way traders approach the market.
For traders and investors, embracing AI-driven tools like AI charts can lead to more informed decision-making and improved profitability. By harnessing the power of AI, traders can stay ahead of market trends, mitigate risks, and maximize returns.
Conclusion
The recent $12 surge in IWM, accurately predicted by AI charts, highlights the incredible potential of AI in financial markets. Through advanced technical analysis, sentiment assessment, and volume analysis, AI charts provide a comprehensive and accurate forecast of market movements. As AI technology continues to advance, its integration into trading strategies will undoubtedly become more prevalent, offering traders an unparalleled advantage in navigating the complexities of the financial markets.
The case of IWM serves as a testament to the power of AI in transforming trading strategies and underscores the importance of embracing technological innovations to stay competitive in the ever-evolving world of finance.


