
View an AI chart on Tesla by visiting : https://optionsdoctor.com/
Artificial intelligence (AI) has revolutionized the way we analyze financial markets, providing insights and predictions that were once considered impossible. In recent days, AI charts have been signaling a major sell signal for Tesla, the electric vehicle (EV) giant, on the daily chart for the short term. This development has sparked intense interest among traders and investors, as Tesla’s stock price has been on a roller-coaster ride in recent months. In this article, we will explore the AI-generated sell signal for Tesla and its potential implications for the company’s stock price in the short term.
Understanding AI-Generated Sell Signals
AI-powered algorithms analyze vast amounts of data, including historical price movements, trading volumes, and market trends, to identify patterns and signals that may indicate future price movements. In the case of Tesla, AI charts have detected a pattern that historically precedes a price decline, leading to the generation of a sell signal for the stock.
Factors Contributing to the Sell Signal
Several factors may be contributing to the AI-generated sell signal for Tesla. One key factor is the recent volatility in the stock market, driven by concerns about inflation, interest rates, and global economic growth. Tesla, as a high-growth stock, is particularly sensitive to market fluctuations, and any negative sentiment could lead to a sell-off in the stock.
Additionally, concerns about Tesla’s valuation and future growth prospects may be weighing on the stock price. Tesla’s meteoric rise in recent years has made it one of the most valuable automakers in the world, leading some investors to question whether the stock is overvalued. Any signs of slowing growth or missed targets could further erode investor confidence and contribute to a sell-off in the stock.
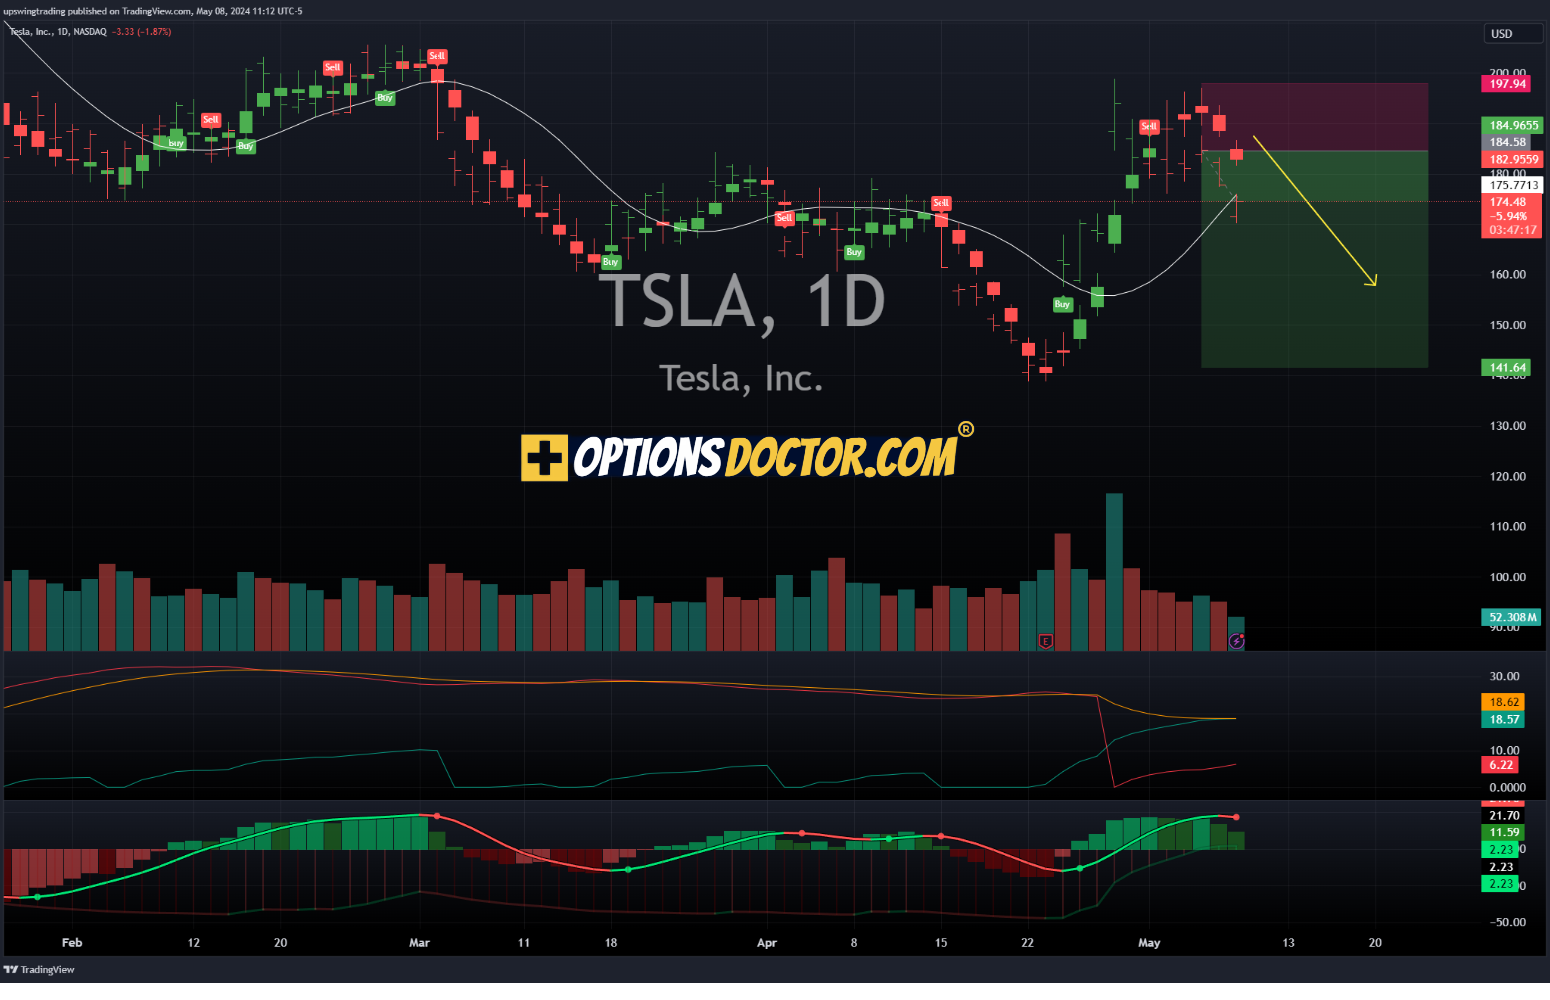
Technical Indicators and Chart Patterns
AI charts also analyze technical indicators and chart patterns to generate sell signals. In the case of Tesla, AI algorithms may be detecting patterns such as lower highs and lower lows, which are typically associated with a bearish trend. Additionally, key technical indicators such as the Relative Strength Index (RSI) and moving averages may be signaling that Tesla is overbought and due for a correction.
Implications for Tesla’s Stock Price
The AI-generated sell signal for Tesla has significant implications for the stock price in the short term. If the sell signal is accurate, we could see a decline in Tesla’s stock price in the coming days or weeks as investors react to the signal and adjust their positions accordingly. However, it is important to note that AI-generated signals are not always accurate and should be used in conjunction with other forms of analysis.
Conclusion
In conclusion, AI charts are showing a major sell signal for Tesla on the daily chart for the short term. While the implications of this sell signal are significant, it is essential for investors to conduct their own research and analysis before making any investment decisions. Tesla’s stock price is notoriously volatile, and factors such as market sentiment, regulatory developments, and company performance can all impact the stock price in the short term. As always, investors should carefully consider their risk tolerance and investment objectives before making any trading decisions.


