Categories
Business Investment News

The Week Ahead: Navigating a Potential Market Pullback Amidst a Shortened Trading Schedule

As we step into a new week of trading, a combination of factors including a shortened trading schedule, the market’s current overbought condition, and a notable absence of positive catalysts, are converging to present a potential scenario for a market pullback. This analysis aims to unpack these elements, exploring how they interplay and the possible ramifications for investors and the broader market.

The Impact of a Shortened Trading Week

Shortened trading weeks, typically due to holidays, can significantly impact market dynamics. With fewer days to trade, the volume of transactions often decreases, leading to higher volatility. The reason behind this is twofold. First, with less time to execute trades, any buy or sell orders can have a pronounced effect on stock prices. Second, institutional investors may opt to stay on the sidelines during such weeks, further reducing liquidity and exacerbating price swings. This reduced trading activity can lead to uncertainty, prompting a cautious approach from investors, especially in a market perceived as overbought.

Understanding the Overbought Market

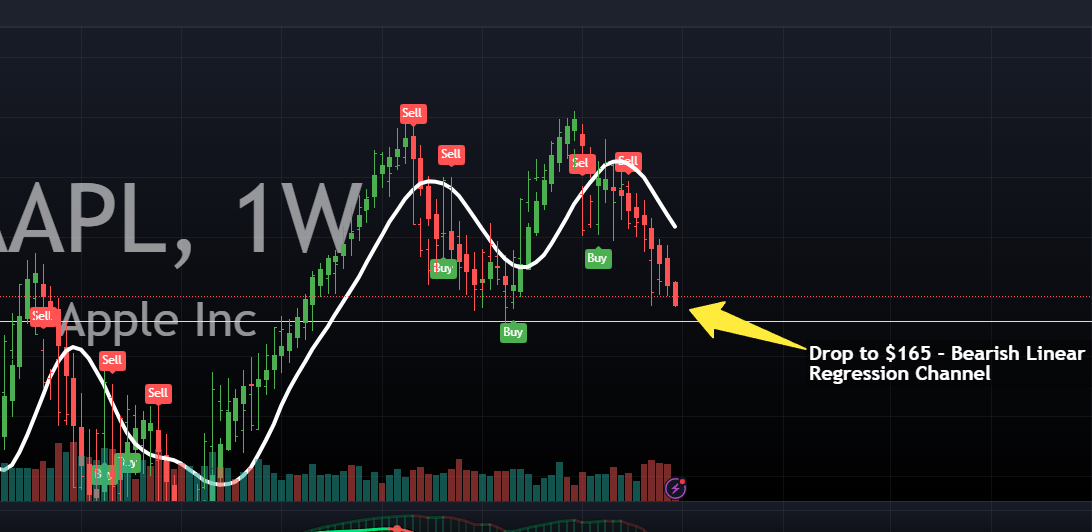
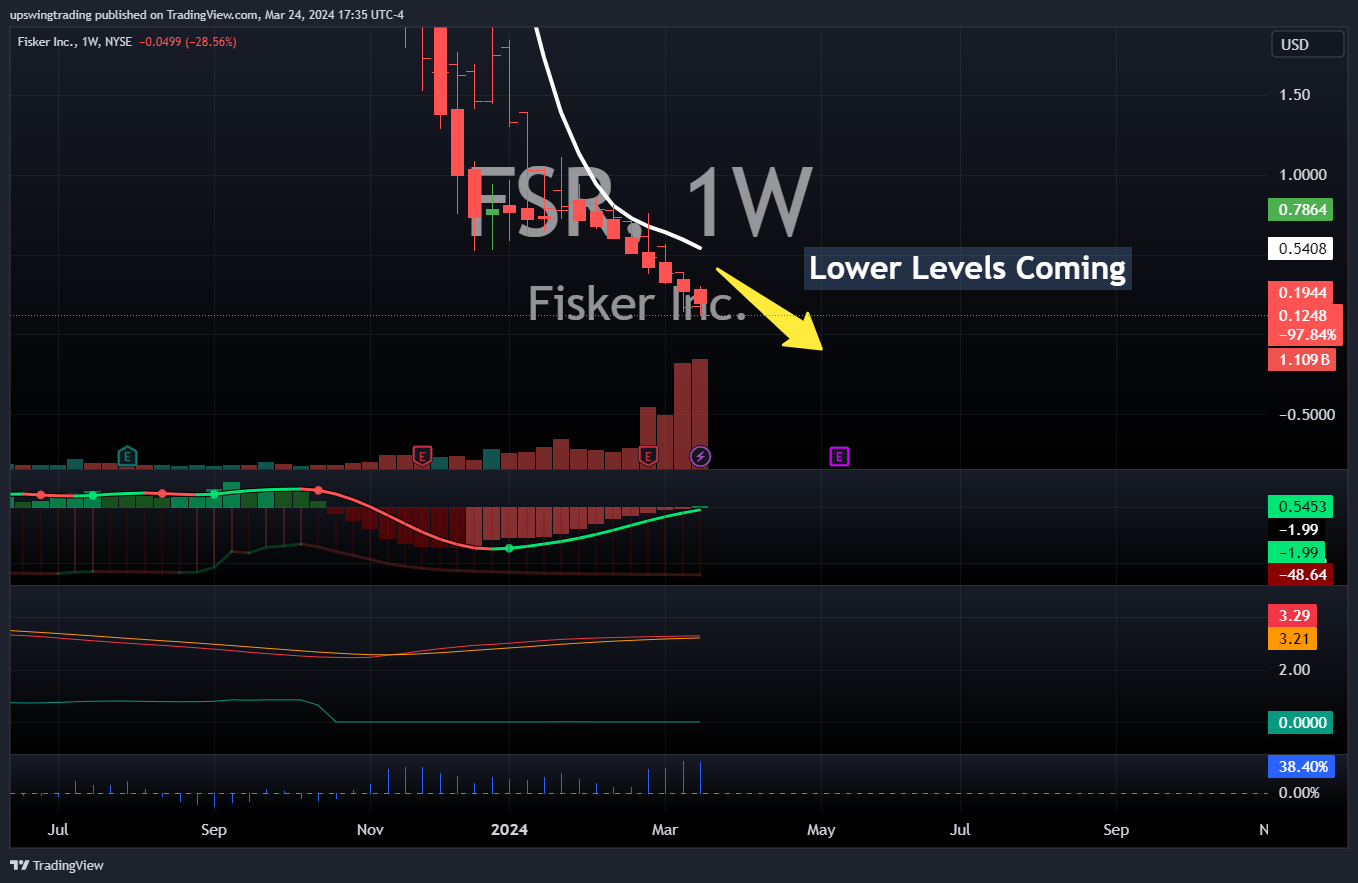
The concept of an “overbought” market is central to technical analysis, indicating that securities are priced higher than their true value, often due to recent buying momentum exceeding normal levels. This condition is typically measured using indicators such as the Relative Strength Index (RSI), with readings above 70 suggesting overbought conditions. Presently, the market exhibits these signs, implying that a correction or pullback could be imminent. Overbought conditions signal that the market might have moved too far, too fast, and a reversion to the mean is often the natural course of action. This reversion can be triggered by any slight shift in investor sentiment or market dynamics, making the current market particularly susceptible to a pullback.

The Absence of Positive Catalysts

Markets thrive on positive catalysts – be it robust earnings reports, favorable economic data, or supportive policy moves. These factors can provide the momentum needed to sustain an upward trajectory, especially in an overbought market. However, as we navigate this week, there’s a palpable absence of such catalysts. The economic calendar appears light, with few significant earnings announcements or economic data releases scheduled. This dearth of potential positive news leaves the market without the fuel needed to counterbalance the inherent volatility of a shortened week and the existing overbought conditions.

Historical Perspective and Investor Sentiment

Historical data shows that markets tend to exhibit caution during periods characterized by such a confluence of factors. Investor sentiment, already wary due to the overbought condition, can quickly shift towards risk aversion in the absence of positive developments. This sentiment shift can accelerate sell-offs, as investors opt to lock in gains or cut losses, further driving the market down. The psychological aspect of investing plays a critical role here, with the fear of missing out (FOMO) that previously drove the market up turning into a fear of staying in (FOSI), prompting withdrawals.

Sectoral Impacts and Opportunities

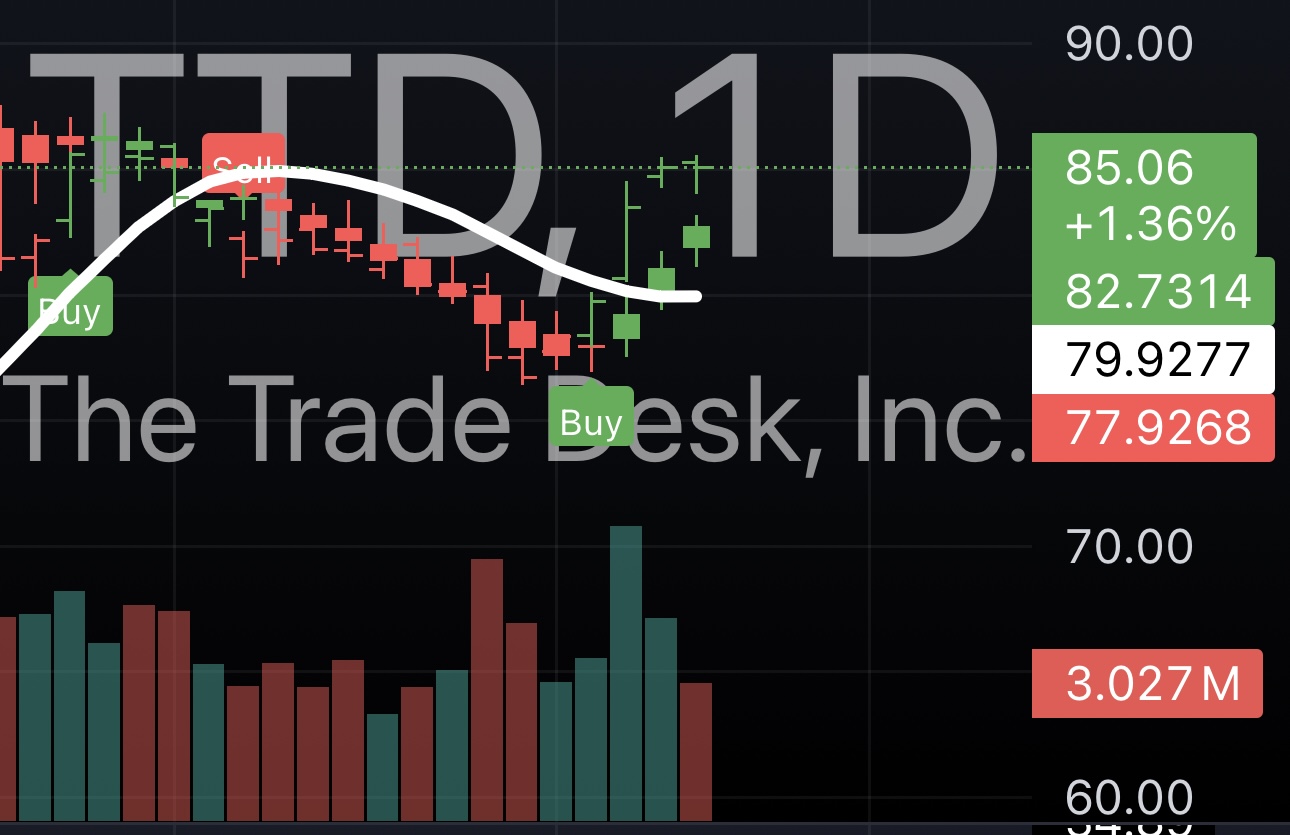
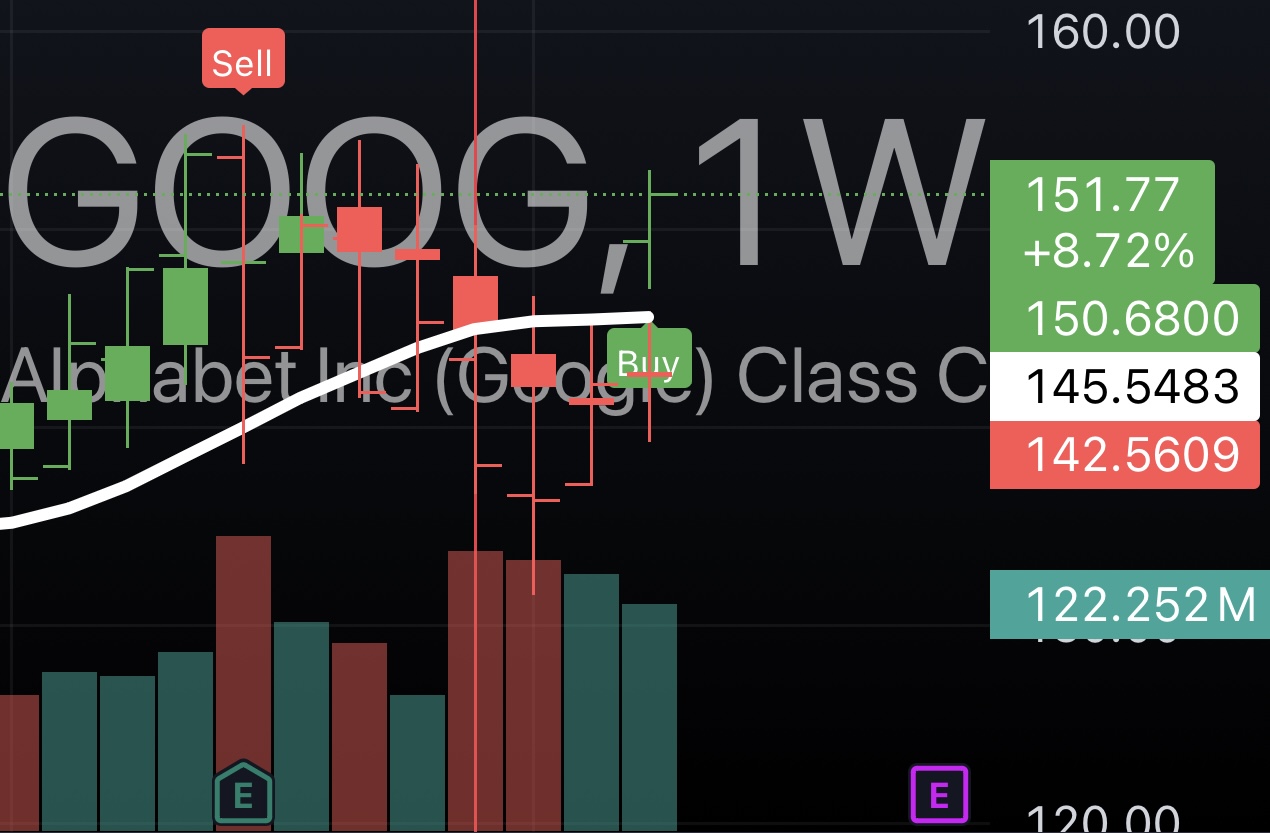
While the overall market may face downward pressure, it’s essential to recognize that such conditions can create opportunities in specific sectors or asset classes. Traditionally defensive sectors like utilities, healthcare, and consumer staples often outperform during times of market stress, as investors flock to safety. Conversely, high-growth and speculative assets, which tend to be more volatile, might bear the brunt of the pullback. For savvy investors, this environment could present a chance to reallocate portfolios, taking advantage of the potential for sector rotation.

Preparing for a Market Pullback

For investors, the prospect of a market pullback necessitates a strategic approach. Diversification remains a cornerstone strategy, helping to mitigate risk across different asset classes. Additionally, adopting a long-term perspective can shield investors from the short-term volatility inherent in such market conditions. Those more risk-averse might consider increasing their cash holdings, providing liquidity to take advantage of lower prices should the market dip. Meanwhile, investors should stay attuned to market developments, ready to adapt their strategies as the situation evolves.

Conclusion

The week ahead presents a nuanced challenge for the market, as the interplay of a shortened trading schedule, overbought conditions, and the absence of positive catalysts could steer us towards a pullback. While such movements can incite concern, they are a natural part of market cycles, offering opportunities for recalibration and reassessment. By understanding the underlying factors at play and adopting a measured approach, investors can navigate these conditions, positioning themselves to thrive in the market’s next phase. As always, the key lies in vigilance, flexibility, and a commitment to strategic planning, ensuring that short-term fluctuations are met with a perspective that values long-term growth and stability.

Categories
Business Investment News

Navigating Headwinds: Apple’s Bearish Outlook Amidst Market Challenges

In the dynamic landscape of the stock market, Apple Inc., a titan of innovation and a staple of resilience, faces a period of speculation and scrutiny. Recent trends and developments have painted a somewhat cautious picture for the tech giant, with analysis indicating a bearish linear regression pattern and a potential dip to the $165 range in the coming days. This article delves into the complexities of Apple’s current market position, exploring the interplay of technical analysis, market sentiment, and external pressures that contribute to its projected trajectory.

[arrow_forms id=’790′]

Understanding Linear Regression Patterns in Stock Analysis

Linear regression analysis serves as a foundational tool for identifying stock price trends over time, offering insights into potential future movements based on historical data. In the case of Apple, a bearish linear regression pattern suggests a downward trend in stock prices, signaling caution among investors. Such trends are discerned through meticulous analysis, taking into account various factors, including market volatility, trading volume, and price fluctuations.

The Bearish Signal: A Closer Look

A bearish pattern, marked by a consistent decline in stock prices, can be influenced by several factors, from company-specific challenges to broader economic conditions. For Apple, a company known for its robust ecosystem and market-leading products, the emergence of a bearish trend warrants a closer examination of underlying causes and potential implications for investors.

Factors Contributing to Apple’s Bearish Outlook

Several concurrent factors could contribute to the observed bearish sentiment surrounding Apple’s stock:

  • Market Saturation: As Apple navigates the mature markets of smartphones and personal computing, questions about the next growth frontier emerge, potentially dampening investor enthusiasm.
  • Supply Chain Constraints: Global disruptions in the supply chain, exacerbated by geopolitical tensions and the ongoing effects of the COVID-19 pandemic, pose significant challenges to Apple’s operations, impacting its ability to meet demand.
  • Regulatory Pressures: Increased scrutiny from regulatory bodies worldwide, concerning everything from antitrust issues to privacy concerns, could influence Apple’s business practices and market perception.
  • Competition Intensification: The relentless pace of innovation in the tech industry means that Apple faces constant pressure from competitors, both from established players and emerging disruptors, potentially affecting its market share and profitability.

The Role of Negative News in Shaping Investor Sentiment

In the short term, investor sentiment can be heavily influenced by news coverage and market rumors. Negative news, whether related to financial performance, product issues, or legal challenges, can lead to rapid shifts in investor behavior, driving stock prices down. For Apple, a company under constant media scrutiny, managing the narrative and addressing concerns transparently is crucial in maintaining investor confidence.

Potential Scenarios Impacting Apple’s Stock

  • Earnings Miss: Quarterly earnings that fall short of analysts’ expectations could lead to immediate negative reactions in the stock market.
  • Product Delays or Failures: Announcements of delays in product launches, or worse, issues with newly released products, can erode consumer and investor trust.
  • Legal and Regulatory Hurdles: Ongoing or new legal battles, particularly those that may result in significant financial penalties or operational restrictions, can have a detrimental impact on stock performance.

Navigating the $165 Range: Implications and Strategies

The projection of Apple’s stock reaching the $165 range in the light of a bearish linear regression pattern and negative news underscores the need for strategic responses from the company and careful analysis by investors. For Apple, this may involve accelerating innovation, diversifying product lines, and enhancing supply chain resilience. For investors, it means closely monitoring developments, diversifying portfolios, and considering long-term value over short-term fluctuations.

Apple’s Path Forward

Despite current challenges, Apple’s history of innovation, strong financial foundation, and loyal customer base provide a solid platform for future growth. Strategic initiatives, from expanding into new product categories like augmented reality and autonomous vehicles to investing in services and content, could redefine its growth trajectory.

Conclusion: A Complex Tapestry of Market Dynamics

Apple’s journey through a period marked by a bearish linear regression pattern and negative news highlights the complex interplay of market dynamics, investor sentiment, and corporate strategy. While the short-term outlook may seem daunting, Apple’s track record of navigating challenges and capitalizing on opportunities underscores the importance of a nuanced approach to stock analysis and investment decision-making. As the market continues to evolve, so too will the narrative around Apple, reminding investors of the inherent uncertainties and the potential for resilience and recovery in the face of adversity.

Categories
Business Investment News

Electrifying the Future: Nissan’s Potential Partnership with Fisker Inc.

In an industry as dynamic and rapidly evolving as electric vehicles, collaborations between established giants and agile startups can create powerful synergies that accelerate innovation, expand market reach, and redefine consumer expectations. The potential partnership between Nissan, a pioneer in mass-market EVs with its Leaf model, and Fisker Inc., known for its eco-friendly and design-forward electric vehicles, is a prospect that has captured the imagination of the automotive world. This strategic alliance could leverage Nissan’s extensive manufacturing capabilities and Fisker’s innovative design and technology to set new benchmarks in the EV sector.

[arrow_forms id=’790′]

Combining Strengths for a Sustainable Future

Manufacturing Expertise Meets Cutting-Edge Design

Nissan brings to the table decades of manufacturing experience, a global supply chain network, and a deep understanding of the mass-market consumer. Fisker Inc., on the other hand, offers fresh perspectives on vehicle design, sustainability, and customer experience in the luxury EV segment. A partnership between these two entities could result in the development of EVs that combine reliability and affordability with sustainable materials and avant-garde aesthetics, appealing to a broad spectrum of consumers.

Accelerating EV Adoption Through Innovation

One of the key barriers to EV adoption has been range anxiety, alongside the availability of charging infrastructure. Nissan’s experience with battery technology, gained through years of developing the Leaf, combined with Fisker’s innovative approach to energy efficiency and battery solutions, could lead to significant advancements in range and charging times. Furthermore, exploring alternative battery technologies or charging solutions could place the partnership at the forefront of addressing consumer concerns, significantly accelerating EV adoption.

Expanding Global Reach

While Nissan has a well-established global presence, Fisker Inc. is still in the early stages of market penetration. A partnership could open new doors for Fisker vehicles to enter emerging markets and leverage Nissan’s existing dealership networks and customer base. Conversely, Nissan could benefit from Fisker’s strong brand identity in sustainability and luxury EVs to enhance its own offerings and appeal to a segment of the market increasingly concerned with environmental impact.

Collaboration in Autonomous and Connected Technologies

The future of mobility extends beyond electrification to include autonomous driving and connected car technologies. Nissan has invested significantly in these areas through its Intelligent Mobility vision, while Fisker Inc. has also expressed ambitions to integrate advanced autonomous systems into its vehicles. A collaborative effort could combine resources and expertise to accelerate the development of these technologies, potentially leading to safer, more efficient, and more connected vehicles.

Addressing the Sustainability Challenge

Both companies have shown a commitment to sustainability, not just in terms of vehicle emissions but across the entire lifecycle of their products. By combining Nissan’s initiatives in recycling and materials science with Fisker’s focus on sustainable production and materials, the partnership could set new standards for environmental responsibility in the automotive industry. This would not only appeal to eco-conscious consumers but also help to mitigate the environmental impact of vehicle production and disposal.

Navigating Challenges Together

Regulatory Compliance and Market Dynamics

As global regulations on vehicle emissions become increasingly stringent, automakers must adapt quickly to avoid penalties and maintain market competitiveness. A Nissan-Fisker partnership could pool resources to ensure compliance across different markets, leveraging Nissan’s global experience and Fisker’s agility to navigate the complex regulatory landscape.

Economic and Supply Chain Uncertainties

The automotive industry faces significant challenges from economic fluctuations and supply chain disruptions, as seen during the COVID-19 pandemic. A strategic partnership could provide a buffer against these uncertainties, with shared resources and a diversified supply chain strategy ensuring that both companies can respond more effectively to global events.

Conclusion: A Visionary Alliance

While purely speculative, the potential partnership between Nissan and Fisker Inc. represents a compelling vision of what collaboration in the EV space can achieve. By combining their respective strengths, Nissan and Fisker could not only accelerate the transition to electric mobility but also introduce innovative solutions that redefine what consumers expect from their vehicles. In an industry at the cusp of a major transformation, such partnerships could be the key to navigating the challenges and seizing the opportunities that lie ahead in the journey toward a more sustainable, connected, and electrified future.


Categories
Business Investment News

GameStop’s Strategic Play: Unwrapping Holiday Season Triumphs

In an era where digital transformation shapes every corner of the retail landscape, GameStop’s recent earnings call was among the most anticipated events for investors, gaming enthusiasts, and market analysts. Positioned at the intersection of e-commerce evolution and the resilient demand for physical gaming products, GameStop’s performance over the critical holiday season was poised to reflect not just the company’s adaptability but also the broader trends in consumer electronics and entertainment retail.

A Look Back at GameStop’s Journey

To appreciate the context of GameStop’s holiday season performance, it’s crucial to understand the company’s journey. Once seen as a brick-and-mortar relic in an increasingly digital world, GameStop found itself at the center of a historic market phenomenon in early 2021. Fueled by a passionate online community, GameStop’s stock soared, challenging traditional market dynamics and placing the company squarely in the public eye. This unprecedented attention provided GameStop with a unique opportunity to accelerate its transformation strategy, focusing on digital growth, enhancing the customer experience, and expanding its product offerings.

The 2022 Holiday Season: A Perfect Storm for Success

The holiday season has traditionally been a critical period for retailers, especially in the gaming industry, where new releases and console sales can significantly impact annual revenue. For GameStop, the 2022 holiday season presented a unique set of opportunities:

  1. Console Demand: With the ongoing demand for the latest gaming consoles, including PlayStation 5 and Xbox Series X|S, GameStop was in a prime position to capitalize on its strong relationships with suppliers and its reputation as a go-to destination for gaming hardware.
  2. New Game Releases: The holiday season is synonymous with blockbuster game releases. Titles such as “God of War: Ragnarok” and “Pokémon Scarlet and Violet” were expected to drive significant foot traffic and online sales, appealing to both new gamers and seasoned veterans.
  3. E-commerce and Omnichannel Strategy: GameStop’s enhanced focus on its e-commerce platform and omnichannel retailing was set to play a crucial role during the holiday season. By offering a seamless shopping experience across online and offline channels, GameStop aimed to meet consumers where they are, ensuring convenience and accessibility.
  4. Collectibles and Non-Gaming Merchandise: Expanding beyond traditional gaming products, GameStop has increasingly embraced the sale of collectibles and pop culture merchandise. This diversification strategy not only broadens its customer base but also capitalizes on the holiday gift-giving tradition.

Financial Expectations and Market Impact

Investors and analysts closely watched GameStop’s earnings call for signs of growth, profitability, and strategic direction. Key areas of focus included:

  • Revenue Growth: Strong holiday sales were anticipated to contribute to significant year-over-year revenue growth, reflecting both the success of GameStop’s holiday strategy and the overall health of the gaming market.
  • Profit Margins: With supply chain challenges persisting across the retail sector, GameStop’s ability to manage costs and sustain healthy profit margins was under scrutiny. Efficient inventory management and logistics were critical in maximizing holiday season profitability.
  • Strategic Initiatives: Beyond immediate financial results, insights into GameStop’s ongoing strategic initiatives, including digital transformation, partnerships, and market expansion, were eagerly awaited. These elements are vital in assessing GameStop’s long-term value proposition and growth potential.
  • Market Reaction: Given GameStop’s volatile stock history, the market’s reaction to the earnings call was unpredictable. Positive holiday sales figures and optimistic guidance could reinforce investor confidence, while any signs of weakness might prompt volatility.

Conclusion: GameStop’s Moment of Truth

As GameStop navigated the crucial holiday season, its performance during this period was more than just a measure of short-term success—it was a testament to the company’s strategic vision, operational resilience, and adaptability in an ever-changing retail landscape. The earnings call provided a pivotal moment for GameStop to showcase its achievements, outline future growth pathways, and reaffirm its position within the competitive gaming industry. For stakeholders, understanding GameStop’s holiday season performance offered essential insights into the company’s health and its role in the broader narrative of retail transformation and digital innovation in the gaming world.

Categories
Business Investment News

Understanding FSR’s Continued Heavy Selling Pressure and Projections

As financial markets continue to be arenas of constant flux and volatility, certain stocks stand out for their remarkable performance, whether positive or negative. One such stock that has been under the spotlight recently is FSR (Fisker Inc.), which has been experiencing relentless selling pressure on both its daily and weekly linear regression charts. This article delves into the reasons behind FSR’s downward trajectory and explores projections indicating a potential further decline of up to 50%.

Understanding FSR’s Heavy Selling Pressure: Fisker Inc., a renowned player in the electric vehicle (EV) industry, has garnered attention for its innovative approach to sustainable transportation solutions. However, despite its promising concept and initial market enthusiasm, FSR has faced significant challenges, resulting in a prolonged period of heavy selling pressure. Several factors contribute to this phenomenon:

  1. Operational Challenges: FSR has encountered obstacles in scaling its operations to meet production targets. Delays in manufacturing and distribution have eroded investor confidence, leading to increased selling activity.
  2. Competitive Landscape: The EV market is fiercely competitive, with established players and new entrants vying for market share. FSR’s position in this landscape is challenged by well-established competitors, further exacerbating selling pressure.
  3. Financial Concerns: Financial instability, characterized by high debt levels or liquidity issues, can trigger selling among investors seeking to mitigate risk. FSR’s financial performance and outlook may not align with market expectations, prompting continued selling.
  4. Market Sentiment: Investor sentiment plays a crucial role in determining stock movements. Negative sentiment surrounding FSR, fueled by concerns over its business model, leadership, or industry trends, contributes to sustained selling pressure.

Analyzing Linear Regression Charts: Linear regression charts offer valuable insights into stock price trends over time, providing analysts with a visual representation of price movements and patterns. By examining both daily and weekly charts for FSR, patterns of heavy selling pressure become apparent:

  1. Daily Linear Regression Chart: On the daily chart, FSR exhibits a consistent downward trend, characterized by frequent sell-offs and minimal periods of recovery. This pattern suggests heightened volatility and selling activity within shorter timeframes, reflecting underlying uncertainties and market dynamics.
  2. Weekly Linear Regression Chart: The weekly chart provides a broader perspective on FSR’s performance, capturing longer-term trends and price movements. Here, the selling pressure appears more pronounced, with sustained downward momentum indicating deeper-rooted challenges facing the stock.

Projections and Future Outlook: Based on the observed patterns and underlying factors, projections indicate that FSR’s downward trajectory may persist, potentially leading to a further decline of up to 50%. Several factors contribute to this pessimistic outlook:

  1. Technical Indicators: Technical analysis tools, such as moving averages and relative strength index (RSI), corroborate the bearish sentiment surrounding FSR, suggesting a continuation of the current downtrend.
  2. Fundamental Analysis: Despite its innovative concept, FSR’s fundamentals, including financial metrics and operational performance, may not support a turnaround in the near term. Without significant improvements in key areas, investor confidence is unlikely to rebound.
  3. Market Dynamics: External factors, such as macroeconomic conditions or industry trends, can influence FSR’s performance. Continued headwinds in the EV sector or broader market volatility could exacerbate selling pressure on the stock.

Conclusion: In conclusion, FSR’s continued heavy selling pressure on both daily and weekly linear regression charts underscores the challenges facing the company amid a dynamic and competitive market environment. While the stock’s downward trajectory may persist in the near term, investors should exercise caution and consider the underlying factors driving this trend. By understanding the dynamics at play and staying informed about market developments, investors can navigate the storm surrounding FSR with greater clarity and confidence.

Categories
Business Featured Investment News

TTD’s Bullish Trajectory: A Linear Regression Analysis Across Time Frames

In the dynamic world of stock trading, investors and analysts alike are perpetually in pursuit of reliable indicators that can forecast future price movements. The Trade Desk (TTD), a prominent player in the digital advertising sector, has recently been the subject of such analytical endeavors. This article delves into a comprehensive linear regression analysis of TTD’s stock performance on daily, weekly, and monthly time frames, shedding light on the bullish signals that suggest a potential run to $90 in the upcoming week.

Linear Regression in Stock Analysis

Linear regression is a statistical method that models the relationship between a dependent variable and one or more independent variables by fitting a linear equation to observed data. In the context of stock analysis, it is used to predict future prices based on past price movements. This method assumes that historical price trends can provide insight into future trends, making it a valuable tool for traders and investors.

Daily Time Frame Analysis

On the daily time frame, TTD’s stock shows a consistent upward trend over the past several weeks. By plotting the closing prices against time and applying linear regression analysis, we can identify a positive slope in the regression line, indicating bullish momentum. The R-squared value, a measure of how well the regression line fits the data, is significantly high, suggesting that the linear model accurately captures the trend in the daily data.

This positive trend on the daily time frame is underpinned by several factors, including robust earnings reports, strategic partnerships, and an optimistic outlook on the digital advertising industry. These factors contribute to increasing investor confidence, reflected in the stock’s upward movement.

Weekly Time Frame Analysis

Expanding our analysis to the weekly time frame offers a broader perspective on TTD’s performance. Here, the linear regression line again demonstrates a positive slope, reinforcing the bullish sentiment observed in the daily analysis. The R-squared value remains high, indicating a strong correlation between time and stock price on a weekly basis.

On this time frame, macroeconomic factors come into play, such as market sentiment, industry trends, and economic indicators. TTD’s consistent growth and resilience in facing industry challenges are key drivers of its positive performance, suggesting a continued upward trajectory.

Monthly Time Frame Analysis

The monthly time frame analysis provides the most comprehensive view of TTD’s long-term trend. The linear regression applied to several years of data reveals a clear upward trend, with the regression line pointing towards sustained growth. This is a testament to TTD’s strong fundamentals, innovative business model, and its ability to adapt to the evolving digital landscape.

Investor confidence is further bolstered by TTD’s strategic investments in technology and data analytics, positioning it to capitalize on the growing demand for digital advertising solutions. These factors, combined with a favorable industry outlook, support the bullish scenario on a monthly basis.

Projection to $90

Given the bullish signals on daily, weekly, and monthly time frames, the projection of TTD’s stock reaching $90 in the upcoming week is grounded in a comprehensive analysis of past performance and market conditions. This projection considers not only the statistical evidence provided by the linear regression analysis but also the fundamental and technical factors that influence stock prices.

To reach this target, TTD would need to maintain its current momentum and potentially benefit from positive market news or financial reports. Investors will also be looking for signs of sustained growth and profitability, which could further drive the stock’s performance.

Conclusion

The linear regression analysis of The Trade Desk (TTD) across daily, weekly, and monthly time frames presents a compelling case for its bullish trajectory. The consistent upward trend, supported by strong fundamentals and a positive industry outlook, suggests that TTD is well-positioned for further gains. While the stock market is inherently unpredictable and subject to various risks, the analysis provides a data-driven rationale for the optimistic projection of TTD reaching $90 in the upcoming week.

As always, investors are advised to conduct their own research and consider a range of factors before making investment decisions. The promising analysis of TTD serves as a valuable indicator but should be integrated with comprehensive market analysis and individual investment strategies.

Categories
Business Investment News

Google Receives Buy Signal on Weekly Linear Regression Chart: A Bullish Outlook Ahead

In the realm of financial markets, particularly in the world of stocks, investors often seek indicators and signals to guide their trading decisions. One such tool, the weekly linear regression chart, has recently signaled a buy opportunity for Google, the technology giant known for its search engine prowess and diverse array of products and services. This buy signal suggests a potential uptick in Google’s stock price in the coming week, with a target price of $155. Let’s delve into what this signal means and why it has sparked optimism among investors.

Understanding the Weekly Linear Regression Chart

Before delving into Google’s specific situation, let’s first understand what a weekly linear regression chart is and how it’s utilized in stock market analysis.

A weekly linear regression chart is a technical analysis tool that helps investors identify trends and potential reversal points in a stock’s price movement over a weekly timeframe. It plots a straight line based on past price data, aiming to capture the overall trend of the stock. This trend line serves as a reference point for assessing the stock’s current price relative to historical price movements.

When analyzing a weekly linear regression chart, investors pay close attention to the slope of the trend line and its relationship with the current price of the stock. A positive slope indicates an upward trend, suggesting that the stock’s price is likely to continue rising. Conversely, a negative slope suggests a downward trend, signaling potential weakness in the stock’s price.

Google’s Buy Signal

Now, let’s turn our attention to Google and its recent buy signal on the weekly linear regression chart.

Google, or Alphabet Inc. as it is formally known, is a leading player in the technology industry, with its core search engine business supplemented by ventures in areas such as cloud computing, advertising, and autonomous vehicles. As such, the performance of Google’s stock is closely monitored by investors worldwide.

Recently, Google’s weekly linear regression chart has exhibited a positive slope, indicating an upward trend in the stock’s price. This suggests that Google’s stock has been steadily appreciating over the weekly timeframe, reflecting growing investor confidence and positive market sentiment.

The buy signal on the weekly linear regression chart further reinforces this bullish outlook. It suggests that Google’s stock is poised for further gains in the near term, with the potential to reach a target price of $155. This target price represents an uptick from the current price level, offering potential upside for investors who position themselves accordingly.

Factors Driving Google’s Uptick

Several factors may be contributing to the bullish outlook for Google’s stock and the buy signal on the weekly linear regression chart:

  1. Strong Financial Performance: Google has consistently delivered strong financial results, driven by its dominant position in online search and advertising. Robust revenue growth, coupled with disciplined cost management, has bolstered investor confidence in the company’s ability to generate sustainable long-term returns.
  2. Innovation and Diversification: Google continues to innovate across various fronts, from artificial intelligence and machine learning to cloud computing and autonomous driving. Its diverse portfolio of products and services positions the company well to capitalize on emerging trends and capture new revenue opportunities.
  3. Market Leadership: Google’s leadership position in online search and digital advertising affords it a competitive advantage in an increasingly digital world. As businesses shift their advertising budgets online and consumers rely more on digital services, Google stands to benefit from this secular trend, driving revenue growth and shareholder value.
  4. Macroeconomic Tailwinds: Favorable macroeconomic conditions, including low interest rates and robust consumer spending, provide a supportive backdrop for Google’s stock price. As the broader economy continues to recover from the impacts of the COVID-19 pandemic, investors may increasingly allocate capital to high-quality growth stocks like Google.

Risks and Considerations

While the buy signal on the weekly linear regression chart and the bullish outlook for Google’s stock are encouraging, it’s essential for investors to consider potential risks and uncertainties:

  1. Market Volatility: Financial markets can be unpredictable, and sudden shifts in investor sentiment or macroeconomic conditions could impact Google’s stock price. Increased market volatility may lead to short-term fluctuations in the stock’s price, requiring investors to maintain a long-term perspective.
  2. Regulatory Scrutiny: As a dominant player in the technology industry, Google is subject to regulatory scrutiny from governments around the world. Antitrust concerns, data privacy regulations, and other regulatory challenges could potentially affect Google’s business operations and financial performance.
  3. Competition: Google operates in highly competitive markets, facing rivals ranging from other tech giants to startups and disruptors. Intense competition could pressure Google’s market share, pricing power, and profitability, potentially impacting its stock price.
  4. Execution Risks: Despite its track record of success, Google faces execution risks related to product development, strategic initiatives, and operational efficiency. Failure to effectively execute on its growth plans could hamper Google’s ability to meet investor expectations and sustain its stock price momentum.

Conclusion

In conclusion, Google’s recent buy signal on the weekly linear regression chart suggests a bullish outlook for the company’s stock in the coming week, with a target price of $155. This positive momentum is driven by factors such as strong financial performance, innovation, market leadership, and favorable macroeconomic conditions.

However, investors should remain mindful of potential risks and uncertainties, including market volatility, regulatory scrutiny, competition, and execution risks. By carefully evaluating these factors and maintaining a disciplined investment approach, investors can make informed decisions regarding their exposure to Google’s stock and capitalize on potential opportunities in the dynamic world of financial markets.

Categories
Business Investment News

A Predictive Dip: Linear Regression Points to a Downward Trend for Apple (AAPL)

In the complex world of stock market analysis, investors constantly seek tools and methodologies to predict future price movements. One such tool, linear regression, applies statistical techniques to historical data to forecast future trends. Recent analysis using linear regression on the weekly chart for Apple Inc. (AAPL) suggests an intriguing outcome: the stock is projected to descend into the 160s in the upcoming week. This insight offers a significant shift in perspective for one of the most closely watched stocks in the global market.

Understanding Linear Regression in Market Analysis

Linear regression is a foundational statistical method used to model the relationship between a dependent variable and one or more independent variables. In the context of stock market analysis, it involves plotting past stock prices against time and then fitting a linear equation to the data. This equation then projects future prices based on the trends established by the historical data.

Applied to Apple’s stock, linear regression analysis involves examining the closing prices over a specified period on the weekly chart. By identifying the trend line that best fits these data points, analysts can predict where the stock price might head in the short term, assuming that past patterns continue.

The Case for Apple’s Downward Trend

Apple Inc., a titan in the technology sector, has enjoyed a long-standing reputation for resilience and growth, buoyed by strong product demand, innovative strategies, and a robust financial performance. However, no company is immune to the ebb and flow of market forces, and AAPL’s stock price is subject to the same volatility and trends as any other.

The linear regression analysis of AAPL’s weekly chart points to a potential decline into the 160s, a movement that may surprise some investors given Apple’s historically strong market position. This projection is grounded in a combination of factors:

  1. Historical Price Movements: The analysis takes into account the recent fluctuations in Apple’s stock price, identifying a trend that suggests a downward movement.
  2. Market Sentiment: Broader market sentiment, influenced by economic indicators, geopolitical tensions, and industry-specific news, can impact investor confidence and, by extension, stock prices.
  3. Technical Indicators: Alongside linear regression, other technical indicators may also support the prediction of a downward trend, including moving averages, RSI, and volume analysis.

Implications for Investors

If AAPL’s stock price does indeed move into the 160s, it would represent a notable shift in the stock’s valuation, potentially impacting investor strategies in several ways:

  • Buy Opportunities: For long-term investors, a dip in price may present a buying opportunity, allowing them to increase their holdings in AAPL at a lower cost.
  • Portfolio Rebalancing: Investors heavily weighted in technology stocks might consider rebalancing their portfolios to mitigate risk.
  • Market Watch: This movement could also serve as a bellwether for broader market trends, particularly within the technology sector.

Navigating Uncertainty

It’s important to note that while linear regression provides a data-driven forecast, the stock market is influenced by a myriad of unpredictable factors. Investors should use this analysis as one of several tools in their decision-making process, always considering the broader economic and market context.

Conclusion

The predictive analysis using linear regression on Apple’s weekly chart offers a compelling case for a forthcoming dip in the stock’s price into the 160s. This projection highlights the value of statistical tools in market analysis, providing investors with insights that can inform their strategies. However, the inherent unpredictability of the stock market requires a balanced approach, combining predictive analytics with comprehensive market understanding and risk management strategies. As always, diversification and due diligence remain the cornerstones of effective investment.

Categories
Business Investment News

The Turning Tide: A Subtle Shift in the Behemoth Tech Market

In recent years, the technology sector has been the linchpin of the stock market, often leading the charge in both bull and bear markets. Titans like Microsoft (MSFT), NVIDIA (NVDA), Apple (AAPL), and Alphabet (GOOG) have not only become household names but also the backbone of investment portfolios, mutual funds, and ETFs worldwide. However, a closer inspection of their technical indicators and market movements suggests a subtle but noticeable shift that may signal a broader change in the market’s direction. This week is poised to be a critical juncture that could determine the future trajectory of these behemoths and, by extension, the market at large.

The Current State: An Overview

The stock market has long been viewed as a forward-looking entity, with investors attempting to anticipate future trends and adjustments. In this context, the significant reliance on technology stocks has been both a boon and a bane. On one hand, the growth and profitability of MSFT, NVDA, AAPL, and GOOG have provided robust returns and stability. On the other hand, the market’s increasing dependency on a handful of tech giants has raised concerns about over-concentration and vulnerability to sector-specific shocks.

As of late, these concerns have been compounded by emerging technical indicators suggesting that the seemingly unshakeable upward trajectory of big tech stocks may be softening. While the fundamentals of these companies remain strong, with healthy balance sheets, innovative product pipelines, and substantial market share, the technical analysis—a method of evaluating securities by analyzing statistics generated by market activity, such as past prices and volume—points towards a potential shift.

Technicals Tell the Tale

Technical analysis encompasses a broad range of indicators and charts, from moving averages to RSI (Relative Strength Index), each providing insights into market sentiment and potential price movements. For the tech giants in question, several key indicators have begun to signal a change:

  • Moving Averages: For stocks like MSFT and AAPL, the short-term moving averages are starting to trend below the longer-term averages, a potential indicator of a bearish reversal.
  • Volume Analysis: A decrease in trading volume can often precede a downturn, as it suggests a lack of conviction among buyers. Recently, there’s been a noticeable drop in volume for NVDA and GOOG, hinting at potential investor caution.
  • Relative Strength Index (RSI): The RSI, which measures the speed and change of price movements, for these tech stocks is edging closer to the overbought territory, indicating that they may be due for a correction.

A Week of Reckoning

The coming week is shaping up to be a critical period for these tech stocks and the market as a whole. Several factors are converging that could influence their direction:

  1. Earnings Reports: As companies begin to release their quarterly earnings, investors will be keenly watching for signs of continued growth, particularly in the face of global economic uncertainties. Any signs of slowing growth could have a disproportionate impact on stock prices.
  2. Economic Indicators: Upcoming economic data, including employment figures and inflation rates, will provide further context for the market’s direction. Strong data may bolster the case for continued growth, while any signs of weakness could exacerbate concerns.
  3. Market Sentiment: The overall mood of investors, influenced by a myriad of factors including geopolitical tensions and domestic policies, will play a crucial role in determining whether the current technical indicators translate into a more significant market correction.

The Bigger Picture

It’s essential to consider that while the technical analysis suggests a potential softening of the market, this does not necessarily portend a drastic downturn. The fundamentals of the big tech companies remain solid, and they continue to operate at the forefront of innovation and market dominance. However, the signals cannot be ignored and warrant a more cautious approach from investors.

Investing in stocks is inherently tied to market cycles, and corrections are a natural and healthy part of these cycles. They can provide opportunities for reassessment and reallocation, allowing investors to position themselves for the next phase of growth. For those heavily invested in tech stocks, it might be prudent to diversify, spreading risk across different sectors and asset classes.

Conclusion

The subtle shift in the technical indicators of big tech stocks like MSFT, NVDA, AAPL, and GOOG suggests that the market may be at a turning point. The coming week is poised to be pivotal, with a slew of factors set to influence the direction of these market leaders. While it’s too early to predict a significant downturn, the signs warrant attention and careful consideration from investors.

As always, the key to navigating the stock market lies in maintaining a balanced and diversified portfolio, staying informed about market trends, and being prepared to adjust strategies in response to changing market conditions. The current softening of the tech market underscores the importance of vigilance and flexibility, reminding us that even the mightiest giants are not immune

Categories
Business Investment News

Bitcoin’s Path to $100,000: Navigating the Future of Cryptocurrency

In the volatile world of cryptocurrency, Bitcoin stands as a beacon of innovation and investment opportunity. Since its inception in 2009, Bitcoin has defied skeptics, overcome volatility, and emerged as the leading digital currency, capturing the imagination of investors, technologists, and the general public alike. As we look to the future, the prospect of Bitcoin reaching the $100,000 milestone is not only intriguing but increasingly plausible. This article explores the fundamental drivers, market dynamics, and global economic factors that could propel Bitcoin to this landmark value, offering insights into the cryptocurrency’s potential trajectory.

Technological Advancements and Network Effects

Bitcoin’s underlying technology, blockchain, has matured significantly since its inception, offering enhanced security, scalability, and transaction efficiency. Innovations such as the Lightning Network are solving scalability issues, enabling faster and cheaper transactions. As these technological improvements continue, Bitcoin’s utility as a digital currency is set to increase, attracting more users and investors to the network. The network effect, where the value of a service increases with the number of its users, plays a crucial role in Bitcoin’s growth. As adoption spreads across individuals and businesses, the demand for Bitcoin is likely to rise, contributing to its price appreciation.

Institutional Adoption and Investment

The last few years have seen a marked shift in how institutions view Bitcoin. Once regarded with skepticism, it’s now embraced by numerous financial institutions, hedge funds, and corporations as a legitimate asset class. This institutional adoption not only brings substantial investment into Bitcoin but also enhances its legitimacy and stability as an investment vehicle. Companies adding Bitcoin to their balance sheets and institutional funds offering Bitcoin investments create a ripple effect, encouraging further adoption and investment from both retail and institutional investors. This growing demand, against the limited supply of Bitcoin, has the potential to drive its price towards the $100,000 mark.

Monetary Policy and Inflation Concerns

Global economic conditions, characterized by low interest rates and expansive monetary policies, have raised concerns about inflation and the devaluation of fiat currencies. In this environment, Bitcoin is increasingly viewed as a hedge against inflation, akin to gold. Its capped supply of 21 million coins stands in stark contrast to fiat currencies that can be printed without limit. As more investors look to protect their wealth from inflation, Bitcoin’s appeal as “digital gold” is likely to grow, supporting its upward price trajectory.

Increased Retail and Mainstream Adoption

The ease of access to Bitcoin has dramatically improved with the proliferation of cryptocurrency exchanges, wallets, and payment platforms. Retail investors can now easily buy, hold, and sell Bitcoin, contributing to its liquidity and market depth. Furthermore, the integration of Bitcoin into payment systems, allowing for transactions in everyday purchases, enhances its utility and acceptance as a currency. This mainstream adoption serves as a critical driver of Bitcoin’s price, as it transitions from a speculative investment to a widely used digital currency.

Regulatory Clarity and Acceptance

Initially, the lack of regulatory clarity was a significant barrier to Bitcoin’s adoption. However, recent years have seen governments and financial authorities around the world taking steps to establish frameworks for cryptocurrencies. While regulatory challenges remain, a clearer regulatory environment provides a level of security and legitimacy to Bitcoin, encouraging wider adoption. Positive regulatory developments can open the doors for more institutional and retail investors to enter the market, further driving demand and price.

Global Economic and Political Uncertainty

In times of economic and political uncertainty, Bitcoin has often been sought as a safe haven asset. Its decentralized nature offers a hedge against country-specific risks, currency devaluation, and geopolitical tensions. As global uncertainties persist, from trade wars to pandemics, the appeal of Bitcoin as a non-sovereign asset is likely to increase, drawing more investors to its relative safety.

Conclusion

The journey of Bitcoin to $100,000 is paved with technological innovations, growing adoption, economic factors, and evolving regulatory landscapes. While the path may be fraught with volatility and uncertainty, the convergence of these drivers supports a bullish outlook for Bitcoin’s future. Institutional adoption, inflation hedging, mainstream acceptance, and the increasing recognition of Bitcoin as a safe haven are collectively forging a strong foundation for its value appreciation.

As we navigate the future, the potential of Bitcoin to reach $100,000 reflects not just the aspirations of investors but the maturing of a digital asset that has captivated the world. While predictions in the cryptocurrency market are inherently speculative, the underlying trends suggest a trajectory that could very well see Bitcoin achieve this historic milestone. The journey towards $100,000 is more than a milestone; it’s a testament to the enduring value and potential of Bitcoin in reshaping finance and investment in the digital age.